By Dhananath Fernando
Originally appeared on The Morning
The recent amendments to the Value-Added Tax (VAT) have once again brought taxation into the national conversation.
Contrary to what many initially assumed, the VAT rate itself has not increased. What has changed is the VAT registration threshold, which has been reduced from Rs. 60 million to Rs. 36 million in annual turnover. As a result, many micro, small, and medium-sized businesses will now fall into the VAT net.
This has naturally triggered criticism that Sri Lanka is relying too heavily on indirect taxes instead of expanding direct taxation. That concern is understandable. Yet when comparing taxes, VAT remains one of the more reasonable forms of taxation despite its imperfections.
That does not mean VAT rates should keep increasing. It simply means that, compared to many other taxes imposed in Sri Lanka, VAT is economically less damaging and comparatively more transparent.
VAT is on the value added
The important principle behind VAT is that the tax is only charged on the value a business adds at each stage of production or distribution.
Take a bicycle manufacturer selling a bicycle for Rs. 10,000. With an 18% VAT, the final selling price becomes Rs. 11,800. The manufacturer collects Rs. 1,800 as VAT on behalf of the Inland Revenue Department (IRD).
However, the manufacturer may have already paid VAT on inputs used to produce the bicycle. Assume tyres, rims, and spokes cost Rs. 5,000 before VAT. With VAT included, the manufacturer pays Rs. 5,900 to suppliers. That means Rs. 900 has already been paid as VAT earlier in the supply chain.
When settling taxes with the IRD, the manufacturer only pays the balance Rs. 900 because the earlier VAT payment can be claimed back as an input credit. In simple terms, VAT is ultimately charged only on the additional value created by the manufacturer, which in this case is the increase from Rs. 5,000 to Rs. 10,000.
This is very different from taxes such as the Social Security Contribution Levy (SSCL), which creates a cascading effect. Under the SSCL, every stage of production pays tax without the ability to deduct what was paid earlier. The supplier pays it, the manufacturer pays it again, and eventually the tax compounds through the entire production chain.
That cascading effect quietly increases costs across the economy. Compared to such taxes, VAT is economically cleaner and less distortive.
Is it impacting the poor the most?
A common criticism against VAT is that it affects the poor disproportionately. The argument usually goes like this: if both a wealthy individual and a poor individual buy one kilogramme of dhal, they both pay the same VAT amount.
On the surface, that sounds unfair. But VAT is fundamentally a consumption tax. Those who consume more pay more. Wealthier households consume significantly more goods and services than poorer households and therefore contribute more VAT overall.
The real issue is not VAT alone. The heavier burden on poor households often comes from Sri Lanka’s complex web of import tariffs, para-tariffs, cess duties, Ports and Airports Development Levy (PAL), and Customs taxes that silently increase the prices of essential goods.
Take construction materials such as cement, steel, wall tiles, or floor tiles. These taxes raise the cost of housing, infrastructure, and business investment. Unlike VAT, these taxes become embedded in the full cost structure. Businesses then finance those inflated costs through expensive loans, which further compounds prices across the economy.
In many sectors, the real cost drivers are tariffs and para-tariffs rather than VAT itself. If policymakers genuinely want to reduce pressure on low-income families, tariff reform deserves far greater attention.
VAT is only charged when a transaction happens
Another reason VAT is comparatively more reasonable is that it is linked directly to transactions.
Unlike personal income tax, where the Government takes a portion of earnings before individuals even decide how to spend them, VAT is only paid when consumption takes place. In that sense, consumers still retain a degree of choice.
If someone decides not to purchase a product or service, no VAT is charged. That transaction-based structure makes VAT comparatively more transparent than many other forms of taxation.
Not charging VAT can also distort competition
High VAT thresholds can also create an uneven playing field between businesses.
Take the poultry industry. Poultry products sold through supermarkets are often subject to VAT, while products sold through informal wet markets may escape it altogether. As a result, supermarket prices appear higher, even when the businesses involved are complying fully with the tax system.
Yet many of these supermarket suppliers are also the companies maintaining hygiene standards, investing in large-scale production, and building systems compatible with export markets. When compliant businesses lose competitiveness because others remain outside the tax net, the incentive to reinvest and expand weakens.
A functioning tax system must also preserve neutrality. Taxes should not unfairly reward one group while penalising another.
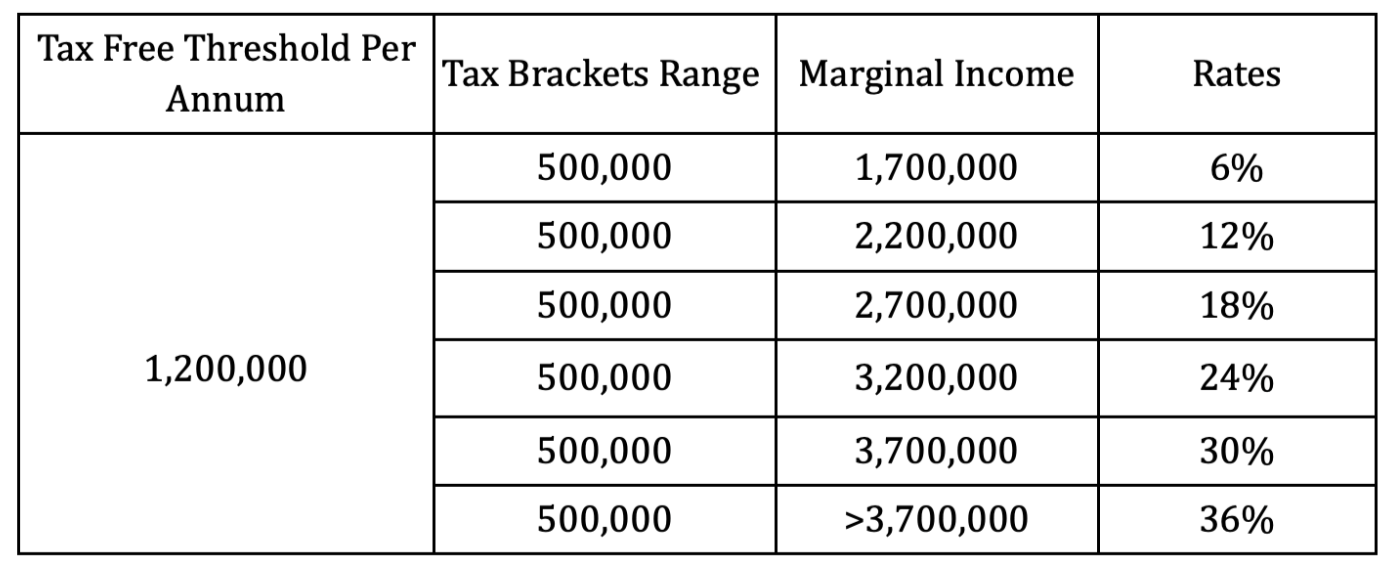
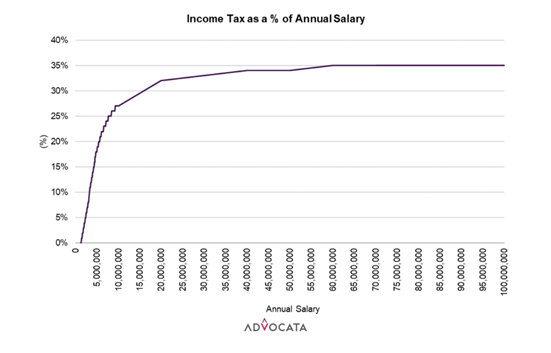
That said, widening the tax net does not automatically justify high tax rates. Sri Lanka must also remain regionally competitive. Corporate taxes are already around 30%, while the highest personal income tax bracket stands at 36%.
If the country continues broadening the tax base, it becomes even more important to ensure overall tax rates remain competitive with global and regional standards.
Taxes alone cannot develop a country
No country has become prosperous purely through taxation. Taxes are necessary to fund public services, but economic growth is what ultimately lifts people out of poverty.
The uncomfortable reality is that as government expenditure continues to rise, governments will continuously search for ways to increase taxes, expand tax nets, or introduce new levies.
If Sri Lanka genuinely wants lower taxes in the long run, the conversation cannot only be about taxation. It must also be about government expenditure, efficiency, and fiscal discipline.
Without controlling expenditure, the country will remain trapped in a cycle where every fiscal problem eventually becomes a tax problem. That is the real conversation Sri Lanka needs to have.